v-plots : Designing Hybrid Charts for the Comparative Analysis of Data Distributions
Abstract
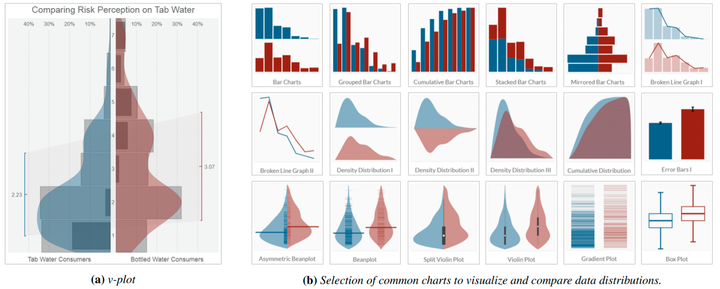
Comparing data distributions is a core focus in descriptive statistics, and part of most data analysis processes across disciplines. In particular, comparing distributions entails numerous tasks, ranging from identifying global distribution properties, comparing aggregated statistics (e.g., mean values), to the local inspection of single cases. While various specialized visualizations have been proposed (e.g., box plots, histograms, or violin plots), they are not usually designed to support more than a few tasks, unless they are combined. In this paper, we present the v-plot designer; a technique for authoring custom hybrid charts, combining mirrored bar charts, difference encodings, and violin-style plots. v-plots are customizable and enable the simultaneous comparison of data distributions on global, local, and aggregation levels. Our system design is grounded in an expert survey that compares and evaluates 20 common visualization techniques to derive guidelines for the task-driven selection of appropriate visualizations. This knowledge externalization step allowed us to develop a guiding wizard that can tailor v-plots to individual tasks and particular distribution properties. Finally, we confirm the usefulness of our system design and the userguiding process by measuring the fitness for purpose and applicability in a second study with four domain and statistic experts.